Eco-Design for Industrial Processes: Building Sustainability In From the Lab
Most of a process's environmental footprint is fixed before scale-up. A practical framework for building eco-design into every step of process development.
 Farhan M.Founder and Co-CEO12 min read

On this page
The footprint is decided before the plant exists
By the time a chemical process reaches the plant, most of its environmental footprint is already fixed. The route, the solvent, the catalyst, the operating temperature, the separation train: these choices are made in the lab, often in the first few months of development. Every one of them sets how much energy, waste, water and carbon the process will consume for the next 20 or 30 years.
The European Commission puts the product version of this plainly: more than 80% of a product's environmental impact is determined at the design stage. Industrial processes follow the same logic, only with higher stakes. A product can be redesigned in a season. A plant, once built, is a 30-year commitment in steel.
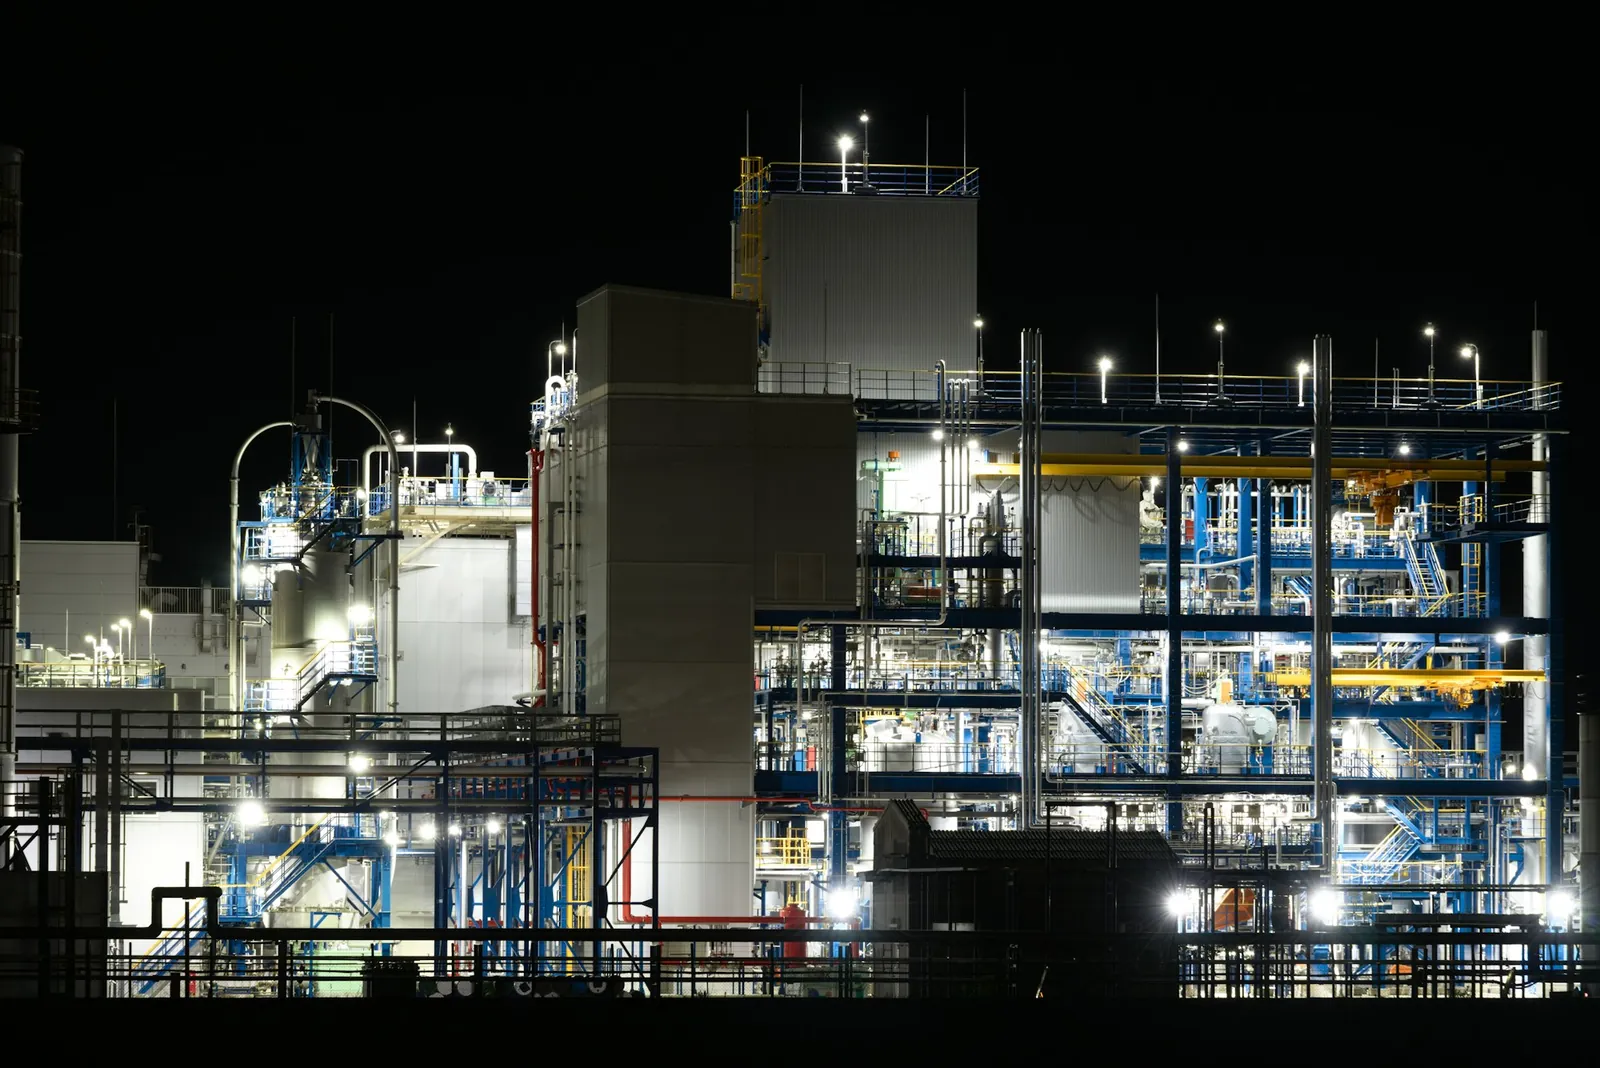
Yet most organisations still assess environmental impact last. A Life Cycle Assessment (LCA) is commissioned after the route is chosen, after the pilot runs, sometimes after the plant is designed. By then, the assessment can only describe the footprint. It can no longer change it.
This article argues for the opposite approach: eco-design built into the scientific method itself, from the first hypothesis to daily plant operations. It covers what eco-design means for processes, why the traditional sequence fails, which regulations are raising the cost of getting it wrong, the metrics that matter, and a practical five-stage framework. It also explains how AI and autonomous labs remove the trade-off that has kept sustainability at the end of the line. For the broader picture, see how DecaOS works across the lab, scale-up and the plant.
What eco-design means for a process, not a product
Eco-design is usually discussed for products: a phone built to be repaired, packaging designed for recycling. For an industrial process, the object being designed is different. It is the sequence of transformations that turns raw materials into a product, along with everything that sequence consumes and emits.
Eco-design of an industrial process means treating environmental performance as a design objective with the same weight as yield, purity, cost and safety, from the first experiment onward. It is not a compliance check. It is a constraint and a target that shapes which experiments get run.
In practice, that covers five levers:
- Route and feedstock: which chemistry you use, and whether inputs are fossil-based, bio-based, recycled or captured carbon.
- Solvents and auxiliaries: often the single largest mass input, and the largest source of waste.
- Energy: reaction temperature and pressure, separation duty, and the heat that could be integrated or recovered.
- Atom and mass efficiency: how much of what goes in ends up in the product.
- End of life of the waste streams: whether by-products can be recycled, valorised or have to be treated.
The key difference from product eco-design is lock-in. A process decision made at the 100 mL scale gets multiplied by every tonne the plant will ever produce. That makes the lab bench the highest-leverage point for sustainability in the entire value chain.
Why "LCA at the end" fails: the design paradox
Every process team runs into the same wall. Early on, when changing the route costs almost nothing, you know too little to measure its impact. Later, when you finally have the data, changing anything costs a fortune. Technology assessment has a name for this: the Collingridge dilemma. Engineers just call it "too late to change."
The traditional sequence makes it worse:
- Chemists optimise for yield and selectivity, because those are what get measured and rewarded.
- Engineers scale what the chemists hand over, solving for throughput and safety.
- The sustainability team runs an LCA on a process that is already frozen.
- The LCA finds hotspots: an energy-hungry distillation, a solvent with a heavy footprint. Fixing them now means reopening development.
- The hotspots are accepted, offset or deferred to a "next-generation" process that may never arrive.
There is a second, quieter problem. Early-stage LCA is hard because the data simply does not exist yet. Research on ex-ante LCA of emerging chemical technologies identifies upscaling as one of the main challenges, because "industrial data is lacking". Lab and pilot data can differ substantially from what an industrial plant will actually do.
So the problem isn't that teams don't care. The process gives them no way to measure impact at the moment they could still change it. Fixing that is the core of eco-design. We cover the methods in depth in our guide to early-stage LCA.
The regulatory clock is now running
For years, eco-design was a voluntary advantage. In Europe it is becoming a cost line. Four frameworks matter most for process industries:
| Framework | What it does | Why it matters at the process level |
|---|---|---|
| CBAM | Puts a carbon price on imports of carbon-intensive goods such as steel, aluminium, fertilisers and hydrogen. The compliance phase began in 2026, certificate sales start 1 February 2027, and 2026 imports are declared by 30 September 2027. | Embedded emissions per tonne become a direct cost. For covered goods, a process's carbon intensity now shows up on the invoice. |
| EU ETS | Free allowances for CBAM sectors are phased out gradually from 2026 to 2034. | EU producers lose their buffer. Energy-intensive steps that were tolerable become expensive year by year. |
| CSRD | After the 2026 Omnibus, applies to EU companies with more than 1,000 employees and over €450 million turnover. Many in-scope companies start reporting in 2028 on FY 2027 data. | Material climate and pollution impacts must be disclosed with real data, including Scope 3. Customers will push those demands down to their suppliers' processes. |
| ESPR | The Ecodesign for Sustainable Products Regulation extends ecodesign requirements and digital product passports across most physical products sold in the EU. | Product-level footprint requirements flow back upstream to the processes that make the materials. |

The common thread: footprint data is moving from the sustainability report into the cost of goods. A process designed today will operate well past 2034, under the full weight of these rules. Designing it without them is designing for a market that will not exist.
The Omnibus narrowed CSRD's direct scope, but it did not reduce what large buyers will ask of their suppliers. Specialty chemical and materials makers selling into in-scope companies should expect footprint questions either way.
The metrics that matter
You cannot design for what you do not measure, and a full LCA is too slow to run after every experiment. Eco-design works best with a layered set of metrics: fast proxies in the lab, fuller assessments as the process matures.
Mass efficiency: E-factor and PMI
Roger Sheldon's E-factor is the mass of waste per mass of product, where waste is "everything but the desired product". Its typical values show where the problem is concentrated:
| Sector | Annual tonnage | Typical E-factor |
|---|---|---|
| Oil refining | 10⁶–10⁸ | < 0.1 |
| Bulk chemicals | 10⁴–10⁶ | < 1–5 |
| Fine chemicals | 10²–10⁴ | 5–50 |
| Pharmaceuticals | 10–10³ | 25 to > 100 |
Source: Sheldon, Green Chemistry, 2017. The smaller the volume, the more waste per kilogram.
Process Mass Intensity (PMI), the metric preferred in pharma, counts everything that goes in, water included, per unit of product:
The ideal PMI is 1. The gap between that and reality is mostly solvent: one report cited by Sheldon finds that solvents make up 80–90% of the non-aqueous mass used to make APIs. That is why solvent choice is the first eco-design lever in fine chemicals and pharma.
Carbon and energy intensity
Mass metrics miss energy. A process can have a low E-factor and still run a high-temperature step or an energy-hungry distillation. Track kg CO₂e per kg of product (Scope 1 and 2 at minimum) and specific energy demand (MJ/kg). Under CBAM and the ETS, this is the metric that turns into cost.
Hazard, solvent and water
- Solvent greenness: rank candidates with an established solvent selection guide before the first screen, not after.
- Hazard profile: toxicity and persistence of reagents and by-products. A low-mass, highly toxic stream can matter more than a high-mass benign one.
- Water intensity: increasingly material in water-stressed regions, and invisible in PMI-only reporting if you only track organic inputs.
From proxies to full LCA
Use the fast proxies (PMI, energy, solvent score) to steer daily experiments. Run a screening LCA at each stage gate. Commission the full, ISO-aligned LCA once the route is locked. The goal is not one perfect number. It is a metric reliable enough, early enough, to change a decision.
A framework: eco-design at every step of the scientific method
Eco-design is not one extra step. It is a question asked at every stage of development: what does this choice commit us to, environmentally, at full scale? The framework below sets out where that question gets asked, and what has to be measured to answer it.
Operating data informs the next design
- 01Hypothesise and select the routeScreen routes, feedstocks and solvents for footprint before the first experiment is run.
- 02Design the experimentsSet PMI, energy and carbon targets next to yield and cost, and plan to optimise them together.
- 03Optimise in the labMeasure mass and energy on every run; map the Pareto front between yield, cost and footprint.
- 04Scale upFlag steps that get worse with scale (drying, distillation, dilution) and run a screening LCA at each gate.
- 05Operate the plantTrack kg CO₂e per kg and energy live; feed plant data back into the models for the next process.
Eco-design across the scientific method: 5 stages, 1 feedback loop.
The earliest stage carries the most leverage and the least data. Every later stage narrows the options but adds evidence. The loop on the left is what turns a single project into a learning system: what the plant actually consumes becomes the prior for the next route decision.
Two rules make the framework work in practice. First, every stage gate includes an environmental criterion, so footprint can stop a project just as yield or safety can. Second, all stages write to the same data record, so a scale-up team inherits the lab's measurements instead of re-estimating them.
Where AI and autonomous labs change the economics
If eco-design is this valuable, why isn't it standard practice? Because adding objectives has always meant adding experiments. Optimising yield alone across a dozen variables is already expensive. Adding energy, PMI and carbon intensity as targets of equal weight multiplies the search space, and classic Design of Experiments (DoE) scales poorly with it.
Three developments are removing that constraint.
1. Multi-objective optimisation finds the trade-offs directly
Bayesian optimisation picks each next experiment based on everything learned so far, instead of following a fixed grid. Its multi-objective form maps the Pareto front: the set of conditions where you cannot improve one objective without giving up another. Researchers at the University of Cambridge have used it to optimise flow reactions for space-time yield and E-factor at the same time, exposing the trade-off between productivity and waste explicitly.
The efficiency gains are large. In one automated campaign published in Chemical Science, the optimiser reached its target in about 23 experiments out of more than 12,000 possible combinations, roughly 0.2% of the search space. When each experiment is that informative, adding sustainability objectives no longer breaks the budget.
2. Autonomous labs close the loop
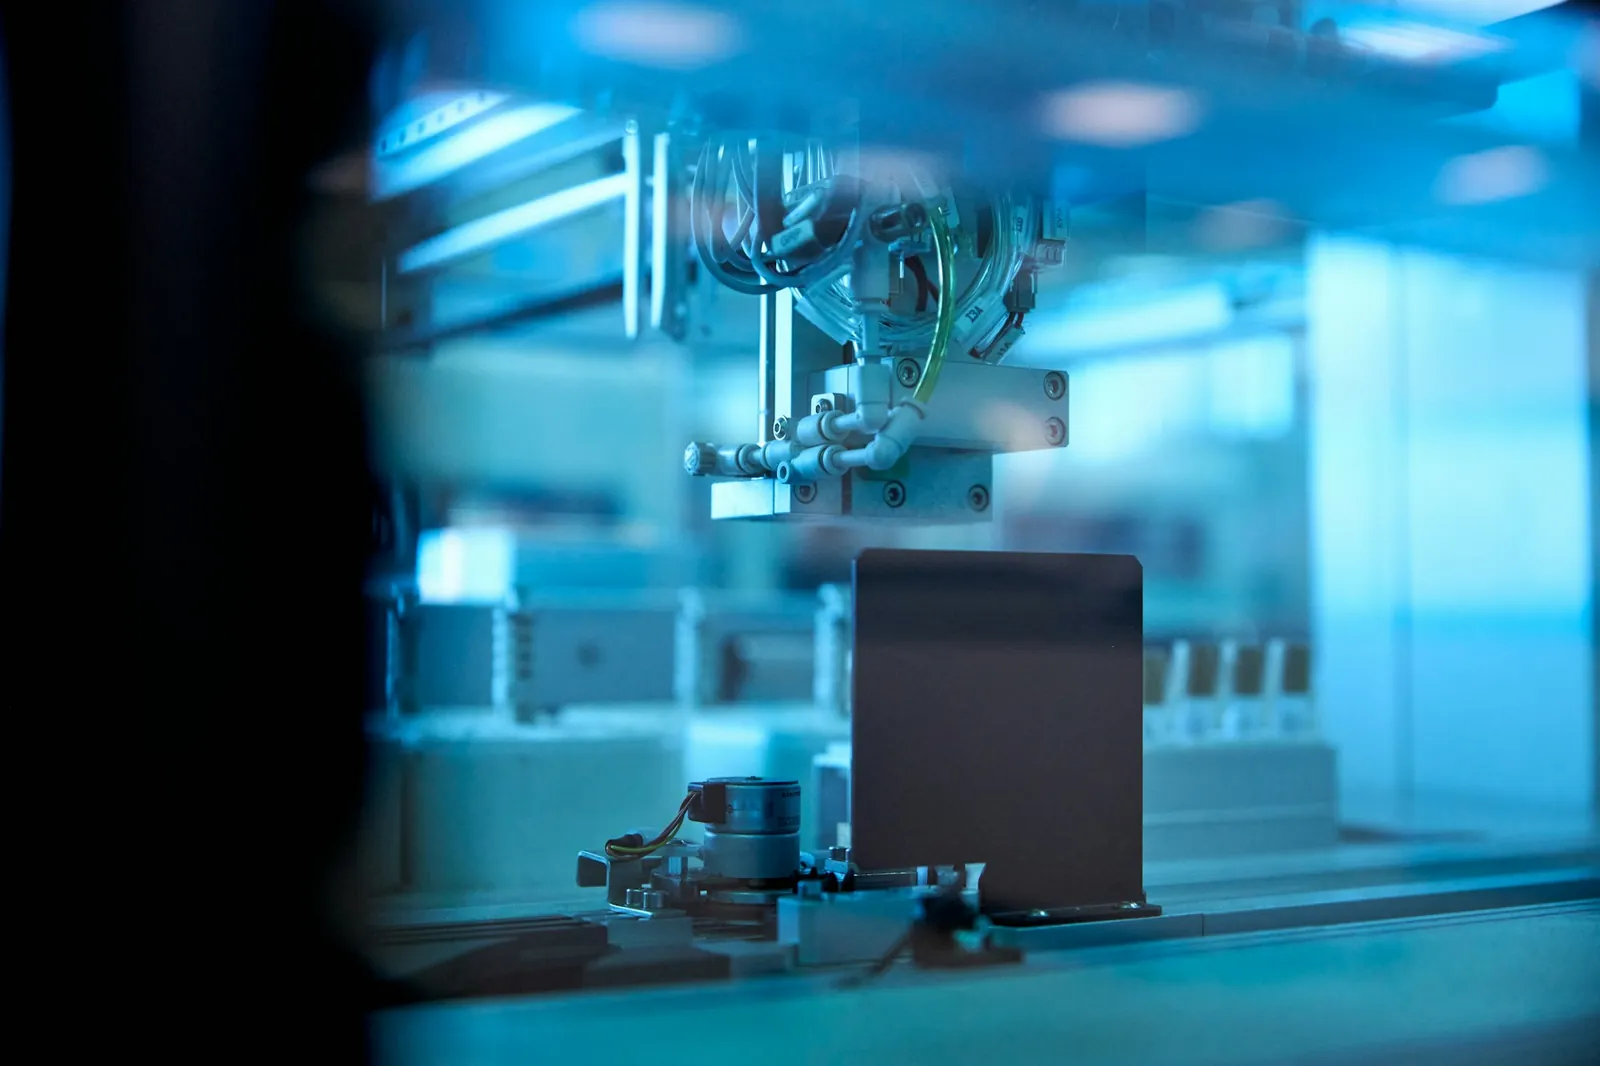
A self-driving lab couples the optimiser to robotic execution and in-line analytics. It designs, runs, measures and learns without waiting on a human for each cycle. That makes sustainability metrics something you can measure on every run, not estimate once at the end. You can see a self-driving lab at work in our 3D Industries view.
3. Foundation models bring prior knowledge
Optimisers start from zero; chemists don't. Models trained across large bodies of chemical and process data can suggest promising routes and solvents, estimate properties and impacts before an experiment is run, and carry learnings from one project into the next. This is the gap DecaPlants is built to close: a process superintelligence platform that embeds eco-design into every step of the scientific method, so environmental performance is a design input from the first hypothesis rather than an audit at the end.
The result is a shift in what is affordable. Eco-design stops being a trade-off you pay for in time, and becomes a constraint the system optimises against automatically.
Getting started: a checklist for your next project
You don't need to rebuild your R&D organisation to start. Pick one active development project and work through this list:
- Name the environmental objectives at kickoff. Choose two or three, such as PMI, kg CO₂e/kg and solvent score, and give them explicit targets next to yield and cost.
- Screen solvents before the first experiment, using an established selection guide. Remove the worst options from the design space.
- Log mass and energy for every run. Your electronic lab notebook should capture total inputs and the heating, cooling and separation each experiment needs.
- Compute PMI automatically, not in a spreadsheet at the end of the quarter.
- Add a screening LCA to every stage gate, and make "no environmental assessment" a reason to hold the gate.
- Optimise against several objectives at once. Replace one-factor-at-a-time or single-objective DoE with a multi-objective approach.
- Flag scale-dependent hotspots early. Drying, distillation, cryogenic steps and high dilution look harmless in the lab and dominate at plant scale.
- Keep the data reusable. Store experiments in a structured format, so the next project starts from what this one learned.
- Report the Pareto front, not a single answer. Show leadership the trade-off between cost, yield and footprint, and let the decision be explicit.
Frequently asked questions
What is eco-design of an industrial process?
Eco-design of an industrial process treats environmental performance (waste, energy, carbon, hazard and water) as a design objective from the first experiment, with the same weight as yield, cost and safety. It differs from product eco-design because process decisions are multiplied across every tonne a plant produces over decades.
How is eco-design different from green chemistry?
Green chemistry provides the principles and molecular-level tools, such as atom economy, safer solvents and catalysis. Eco-design is the practice of applying them systematically across the whole development lifecycle, from route selection through scale-up and operations, with measured targets at each stage.
When should you run an LCA on a new process?
Run a screening LCA from the earliest stages and update it at every stage gate. Use fast proxies such as PMI and energy demand between gates. Keep the full ISO-aligned LCA for when the route is locked. Waiting until the end only tells you about impacts you can no longer change.
What is a good PMI or E-factor?
It depends on the sector. Typical E-factors run below 1–5 for bulk chemicals, 5–50 for fine chemicals and 25 to over 100 for pharmaceuticals. PMI equals E-factor plus one. The useful benchmark is your own baseline and the best published process for a comparable molecule.
Does eco-design slow down process development?
With traditional DoE, adding objectives adds experiments. With multi-objective Bayesian optimisation and autonomous labs, sustainability becomes one more objective the system optimises against, with little extra experimental cost.
Sustainability is a design input, not a report
The processes being designed in labs today will run through the full phase-in of CBAM, the end of free ETS allowances, and a decade of tightening disclosure. Their footprint will be set long before any of those rules bite, by choices made at the bench.
The teams that win will not be the ones with the best sustainability reports. They will be the ones who made environmental performance a design objective early enough to change the answer. The metrics exist. The optimisation methods exist. What has been missing is a way to apply them at the speed of R&D.
That is what we are building at DecaPlants. To see how AI changes every stage of development, explore DecaOS on our Tech page, or join our Slack community of scientists and engineers working on sustainable processes.
Sources
- European Commission, Ecodesign Your Future (2012)
- R. A. Sheldon, The E factor 25 years on: the rise of green chemistry and sustainability, Green Chemistry (2017)
- N. Tsoy, Life cycle assessment of emerging chemical technology systems: challenges and future needs, PhD thesis, Leiden University (2024)
- ICAP, EU adopts simplifications of CBAM rules ahead of the compliance phase starting in 2026
- Parallax, CSRD after the Omnibus: where things stand (2026)
- A. A. Lapkin, Multi-Objective Bayesian Optimisation for Sustainable Reactions Development, AIChE Annual Meeting (2024)
- O. Schilter et al., Combining Bayesian optimization and automation to simultaneously optimize reaction conditions and routes, Chemical Science (2024)
More from the blog
All articles
Reducing Process Mass Intensity in API Manufacturing with AI
Solvents and water are most of an API's mass footprint. Benchmarks, seven proven levers and how AI-driven optimisation cuts PMI without trading yield or purity.
Read article
Early-Stage LCA: How to Assess Environmental Impact Before a Process Is Designed
How to run an LCA when a process only exists in the lab: prospective methods, upscaling lab data, stage-gate depth, and decisions that survive uncertainty.
Read article